The Labour Party won the 2005 UK general election with 35.3% of the popular British vote.
The Conservative Party was just a few points behind with points behind at 32.3% of the popular vote, but because of the first past the post voting system, the Labour Party had a significant majority with 356 parliamentary seats (MPs) compared to 198 seats for The Conservative Party.
For a new poll see the UK General Election 2019 poll.
How did you vote in the general election 2010?
 Just over 4 years on with political scandal after scandal, all political polls pointed to a Conservative win at the 2010 general election with speculation of a possible Hung Parliament (rare in British politics).
We’ve been living with a coalition Conservative/Lib Dem government since May 2010.
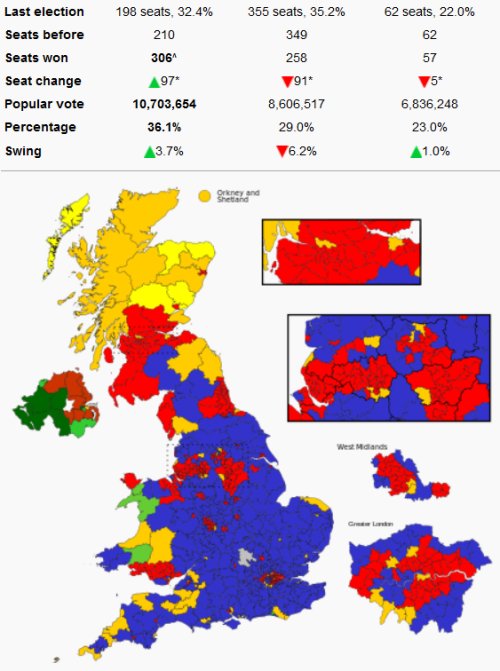
2010 General Election Results
With no overall winner the Conservative Party with 36.1% (306 MPs) of the popular vote and the Liberal Democrats with 23.0% (57 MPs) formed a coalition government.
The Labour Party lost the 2010 UK general election with 29.0% (258 MPs) of the popular British vote.
| Political Party | MPs | + | – | Net | Total Votes | % | Swing | |
|---|---|---|---|---|---|---|---|---|
| Conservative Party | 306 | 100 | 3 | +97 | 10,706,647 | 36.1 | +3.8 | |
| Labour Party | 258 | 3 | 94 | -91 | 8,604,358 | 29.0 | -6.2 | |
| Liberal Democrat Party | 57 | 8 | 13 | -5 | 6,827,938 | 23.0 | +1.0 | |
| UKIP | 0 | 0 | 0 | 0 | 917,832 | 3.1 | +0.9 | |
| BNP | 0 | 0 | 0 | 0 | 563,743 | 1.9 | +1.2 | |
| SNP | 6 | 0 | 0 | 0 | 491,386 | 1.7 | +0.1 | |
| Green Party | 1 | 1 | 0 | +1 | 285,616 | 1.0 | -0.1 | |
| Sinn Féin Party | 5 | 0 | 0 | 0 | 171,942 | 0.6 | -0.1 | |
| DUP | 8 | 0 | 1 | -1 | 168,216 | 0.6 | -0.3 | |
| Plaid Cymru Party | 3 | 1 | 0 | +1 | 165,394 | 0.6 | -0.1 | |
| SDLP | 3 | 0 | 0 | 0 | 110,970 | 0.4 | -0.1 | |
| Conservatives and Unionists | 0 | 0 | 1 | -1 | 102,361 | 0.3 | -0.1 | |
| Alliance Party | 1 | 1 | 0 | +1 | 42,762 | 0.1 | 0.0 | |
| Respect Party | 0 | 0 | 1 | -1 | 33,251 | 0.1 | -0.1 | |
| Independent – Sylvia Hermon | 1 | 1 | 0 | +1 | 21,181 | 0.1 | na | |
| Health Concern Party | 0 | 0 | 1 | -1 | 16,150 | 0.1 | 0.0 | |
| Blaenau Gwent People’s Voice | 0 | 0 | 1 | -1 | 6,458 | 0.0 | -0.1 | |
| Other Parties | 0 | 0 | 0 | 0 | 247,711 | 1.2 | – |
There was a 65.1% turnout with 29,653,638 votes cast.
Above are all the parties that have MPs or lost MPs, plus UKIP and the BNP due to their interest.
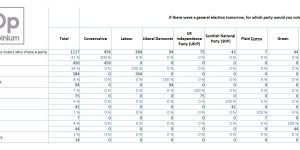
General Election 2010 Polls
Take a look at Weekly General Election Poll Results to see how British people have voted in the above General Election Poll this week (updated every Saturday until the election).
[poll id=”2″]
2005 General Election Popular Vote Comparison
# Labour Party – 35.3%
# Conservative Party – 32.3%
# Liberal Democrats Party – 22.1%
# UK Independence Party (UKIP) – 2.2%
# Green Party – 1.0%
# British National Party (BNP) – 0.7%
# Plaid Cymru Party – 0.6%
I’ve included the main political parties from the 2005 general election, they are listed in the order from most votes (The Labour Party) to least votes.
The first percentage value in brackets is percentage of the popular vote, for example the Labour Party received 35.3% of the popular vote. The second percentage value is based on the number of votes from this general election poll.
The 2005 UK General Election Results
Below is a list of the top 20 political parties (ordered by popular vote %) from the 2005 general election, only 12 of which gained parliamentary seats (MPs)!
Labour Party : 356 MPs
Conservative Party : 198 MPs
Liberal Democrat Party : 62 MPs
UKIP Party : 0 MPs
SNP Party : 6 MPs
Green Party : 0 MPs
Democratic Unionist Party : 9 MPs
BNP Party : 0 MPs
Plaid Cymru Party : 3 MPs
Sinn Féin Party : 5 MPs
Ulster Unionist Party : 1 MP
Social Democratic and Labour Party : 3 MPs
Independent Parties : 1 MP
Respect Party : 1 MP
Scottish Socialist Party : 0 MPs
Alliance Party : 0 MPs
Scottish Green Party : 0 MPs
Socialist Labour Party : 0 MPs
Liberal Party : 0 MPs
Health Concern Party : 1 MP
General Election 2010 Results.
How did you vote in the next General Election 2010 and are you happy with the outcome?
David Law


Can i ask a code for voting poll?..i really need it for my project .please
This site runs on WordPress and uses the poll plugin called WP-Polls from https://lesterchan.net/portfolio/programming/php/, so if you want to use the same poll software you’ll need a WordPress site first.
David
Please may you inform me on who wrote this article as I need to reference it for one of my essay
Thank You.
Dennis
The authors name is David Law